Sentiment Analysis Results and Interactive Search
Introduction
This is a continuation of an earlier project that used ChatGPT to generate sentiment scores from Google reviews of Houston coffee shops. In that phase, ChatGPT was given specific topics by which review context could be ‘binned’ and associated sentiment scores given. So for example: “Worst latte I’ve ever tasted, but staff is nice” would result in something like: "Latte": 0.1, and "Friendliness": 0.9. Analysis of 14,620 reviews across 29 possible topics resulted in 39,620 sentiment scores! If you’d like more detail about how these sentiment scores were generated, please see this blog post: Coffee Shop Review Classification and Sentiment Analysis With ChatGPT 4.1 -Mini.
In this phase, Tableau’s dashboard tools were used to create interactive visualizations that help explore the results of the sentiment analysis.
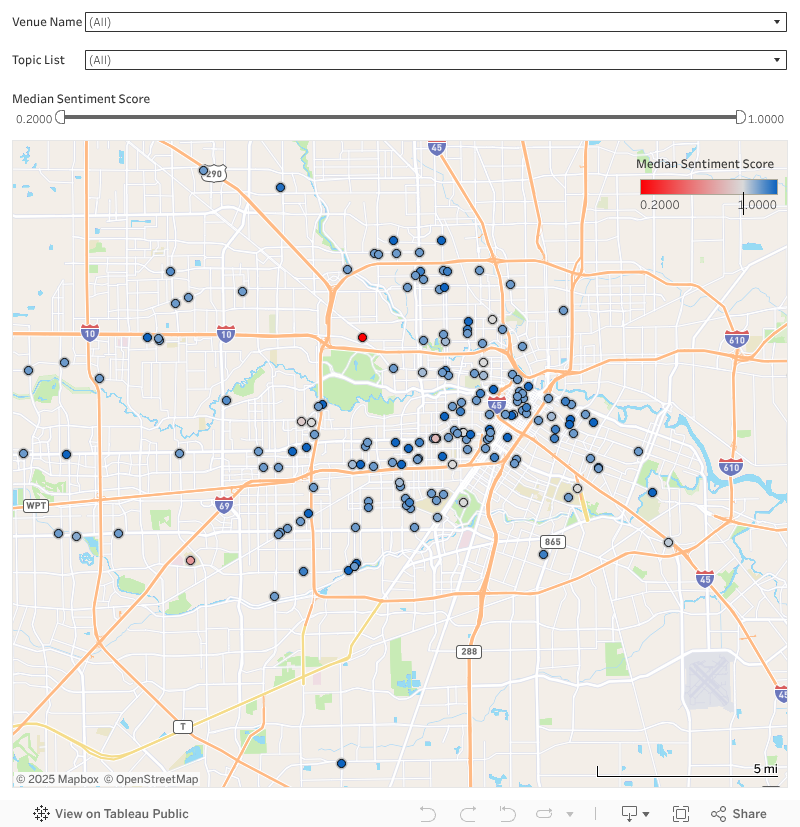
Searchable Map
The map below can be used to filter results by topic(s) of interest, venue, and desired median sentiment score. So for example, if you’re interested in finding the best coffee shop based on WIFI and Chai Lattes you can select those topics and quickly find the best coffee shops to visit in your area.
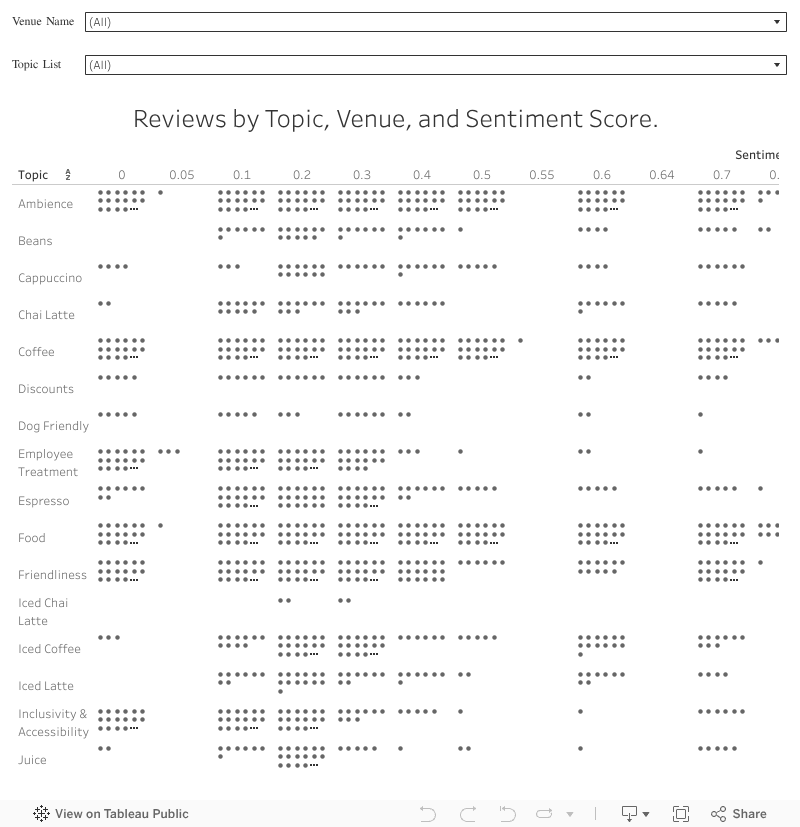
Deeper Look Into Reviews
One of the key challenges for this project was filtering and visualizing individual reviews. I originally intended to incorporate reviews into the tooltip of the geographic data above, and while it is possible to simply pull a review for a venue that approximates a certain topic and median sentiment score, the variation and subtlety does not translate well in a single example. For that reason, I created two additional visualizations to better express how the sentiment scores contribute to the map above.
The table below can be filtered in a similar fashion to the map above to explore reviews in depth, so if you’re curious about why a venue has particular median sentiment rating you can dive into those reviews below!
Note: Due to the volume of data, filtering by a single venue typically yields the clearest and most responsive results.
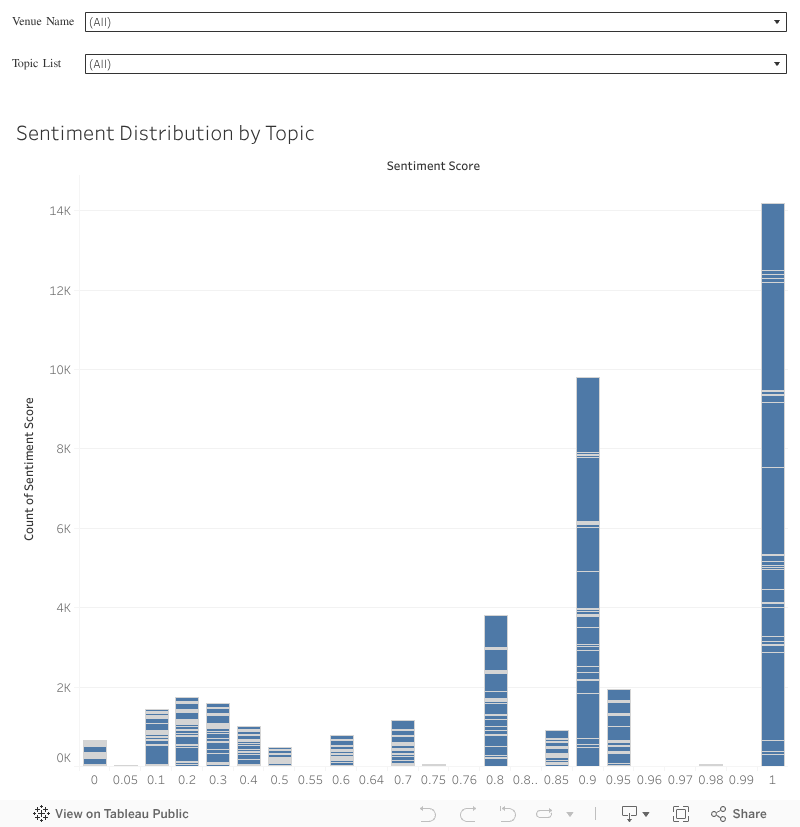
Overall, sentiment scores are bimodal and left skewed with the low sentiment scores being less likely. A bimodal distribution makes intuitive sense. People are generally more motivated to talk about experiences that are either more positive or negative, while ignoring neutral experiences. The median value for all topics and all venues is a whopping .9- suggesting that people are much more likely to take time to write a review if they’ve had a good time.
Conclusion and Future Work
This project series demonstrates the power of large language models like ChatGPT 4.1-mini to extract structured, interpretable insights from unstructured review data at scale. By assigning topic-specific sentiment scores to over 14,000 Google reviews, users are able to go beyond basic star ratings and uncover a more nuanced view of customer experiences across Houston coffee shops. The resulting visualizations offer an interactive way to explore these topics, whether you're hunting for the best Chai Latte or gauging how welcoming a space is for remote work.
Inclusivity & Accessibility and Employee Treatment are two of the more interesting topics that ChatGPT was tasked with identifying and scoring. While ChatGPT generally scored these topics appropriately as zero-shot cases, they don’t always stay consistent with focus. For example, sometimes employee treatment refers to how the customer is treated by the employee, and other times it may refer to how the employee is treated by the establishment (as intended). Providing more explicit definitions for nuanced topics would improve reliability between reviews.
Looking ahead, there’s plenty of opportunity to extend this work. Expanding to domains other than coffee shops such as museums, online retailers, or healthcare - where review context often carries significant weight beyond star ratings offers potential customers insight beyond curated selling points, allowing form more informed decision making.